Support Vector Machine
Support vector machines are supervised learning model that can be applied to classififcation problems as well as regressions.
In this demonstration, applications of its classification abilities will be demonstrated. The first example will be of Recrod data in R and the second will be of text data in Python. For each of these, three different kernels will be applied.
The results will be compared to determine the best kernel. It is important to note that SVMs are unable to be used on mixed data. as such the data types were numericized before runnin the algorithm.
Record Data in R
raw data
code
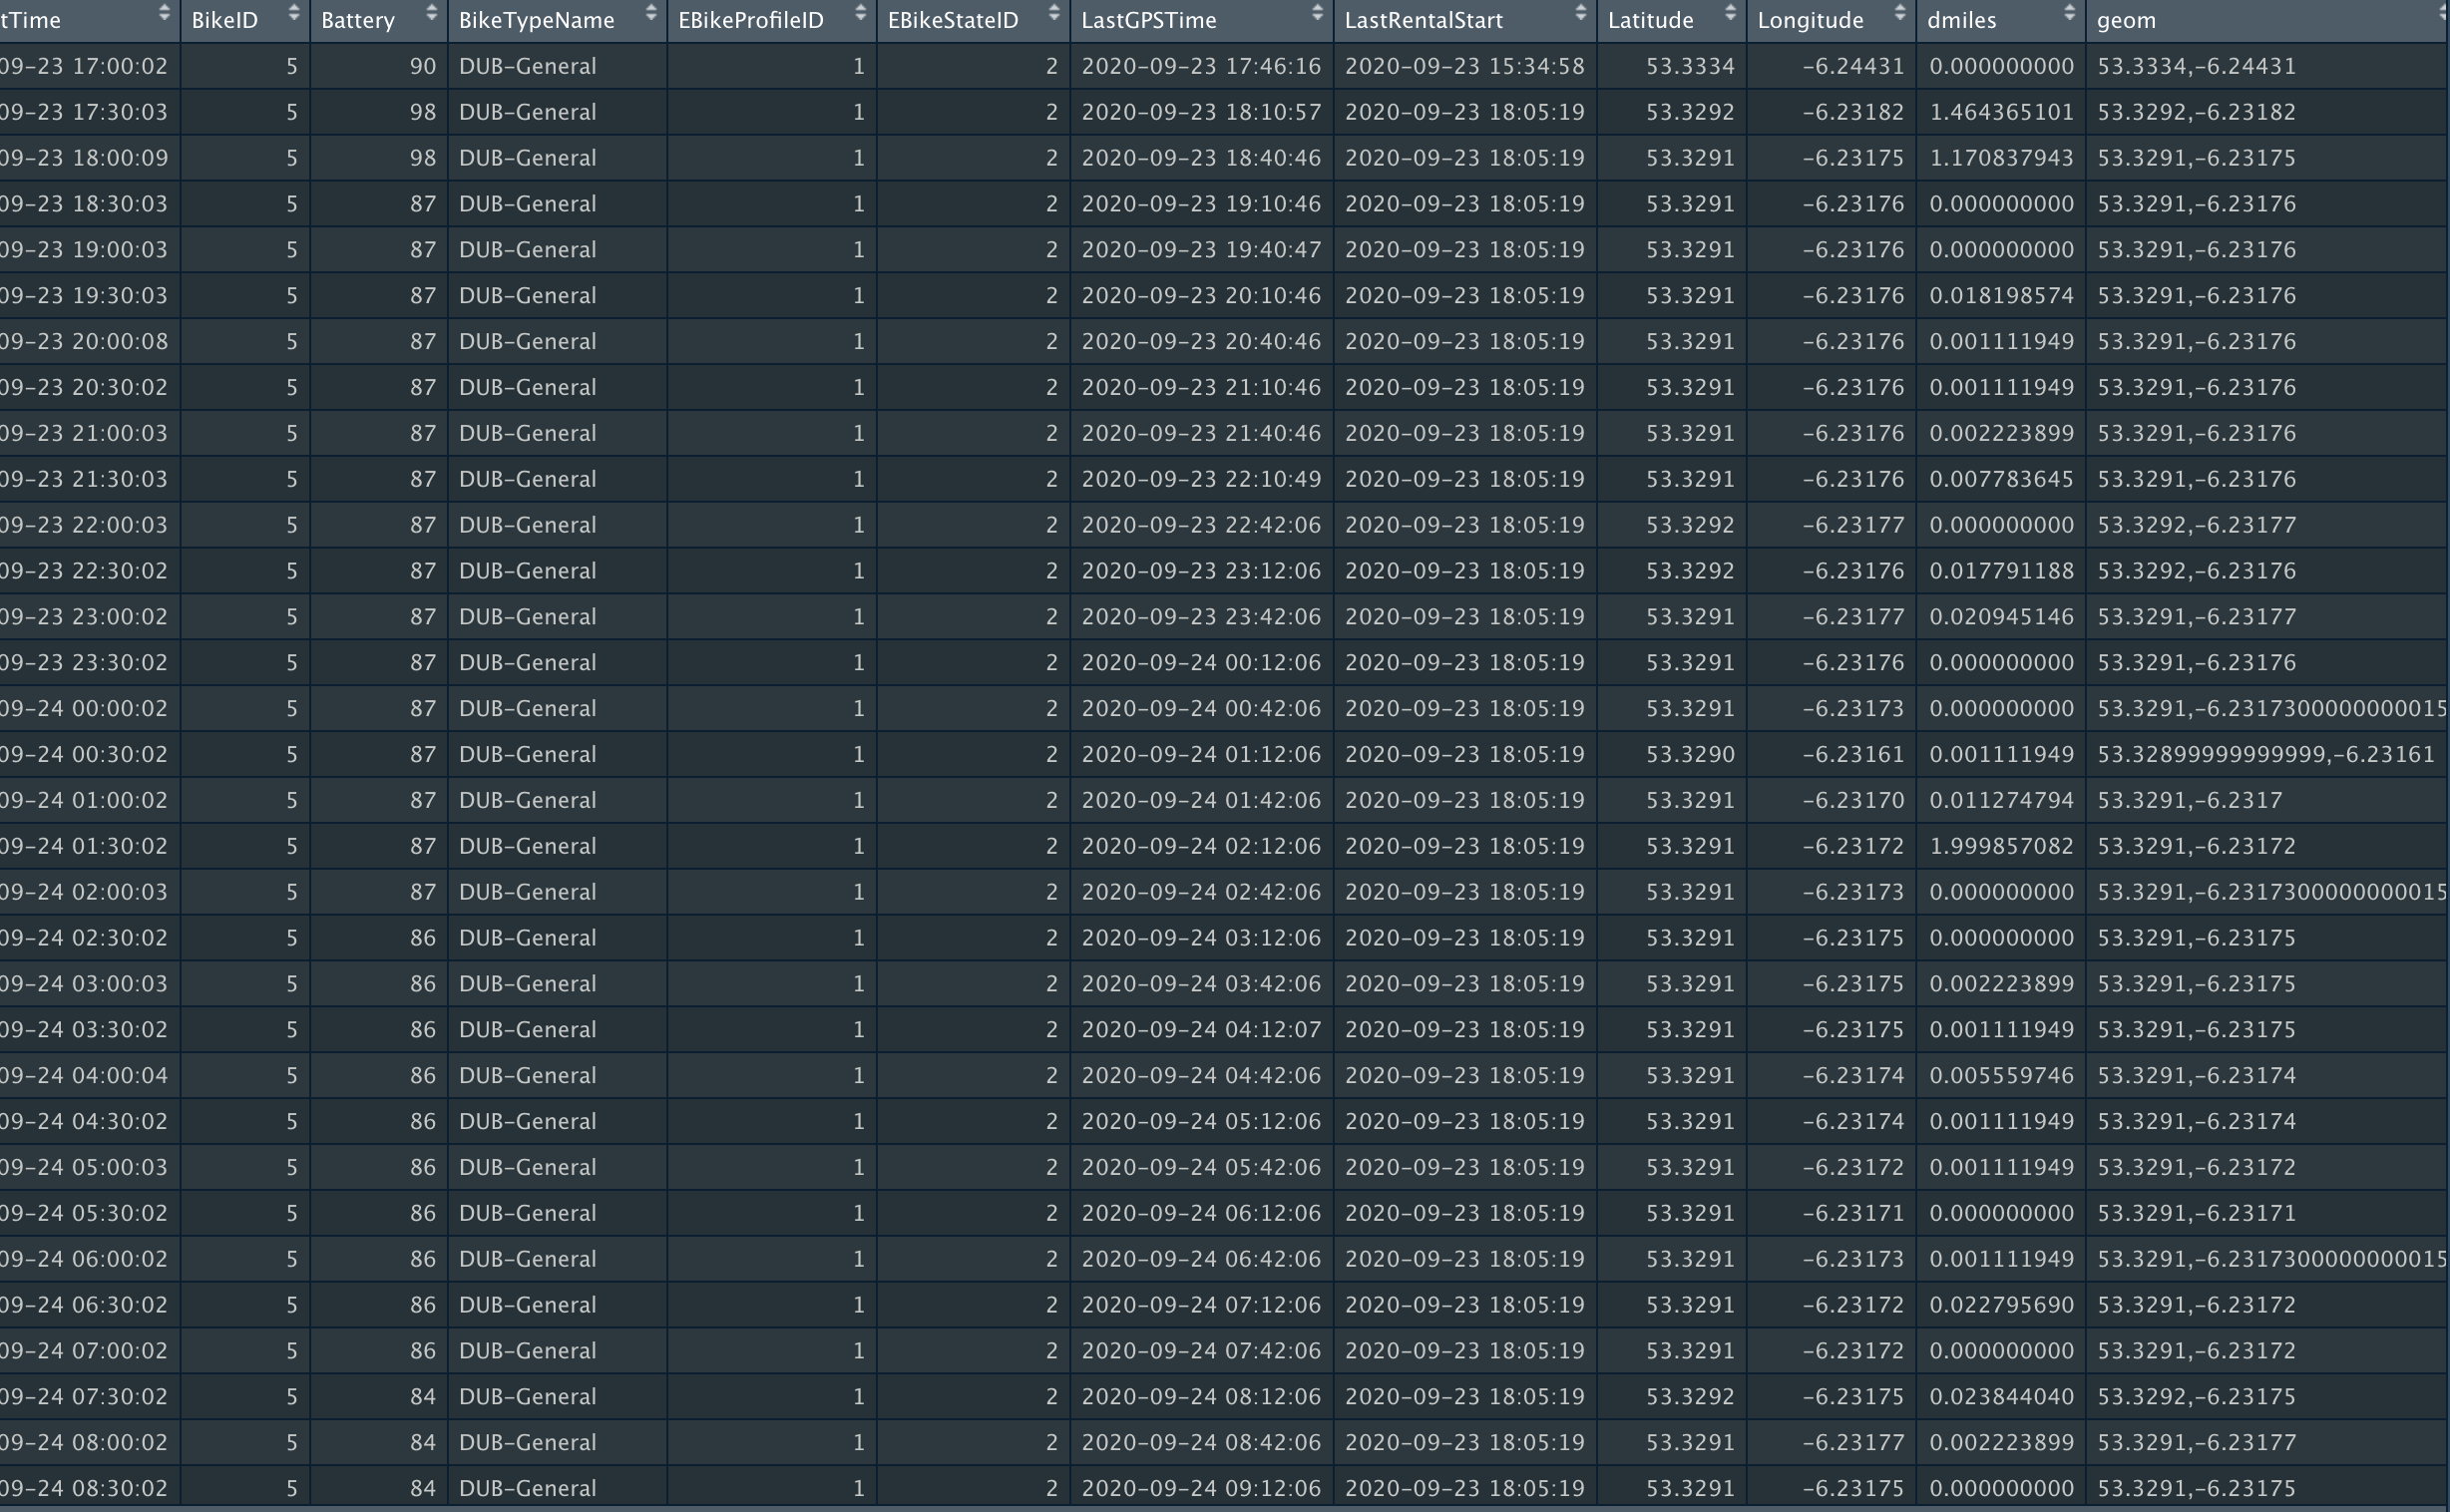
after the data cleaning process, the data set has been divided into a training set and test set. The test set is 3/4 of the entire data set. Further more, we have stored the labels for both
test set and train set in seperate data frames.
Three different kernels were ran on the data. 1) linear kernel 2) Polynomial kernel 3) RBF kernel
The following graphs provide the reader with each models effectiveness.
Linear Kernel

An interpretation from this graph is that as the there seems
to be a clear distinction between weekdays and weekends as illustrated
by the cream and red cut off. however even during the weekdays,
there seems to be cream lines indicating predictive power in these regions as well.
Linear Kernel Heat Map
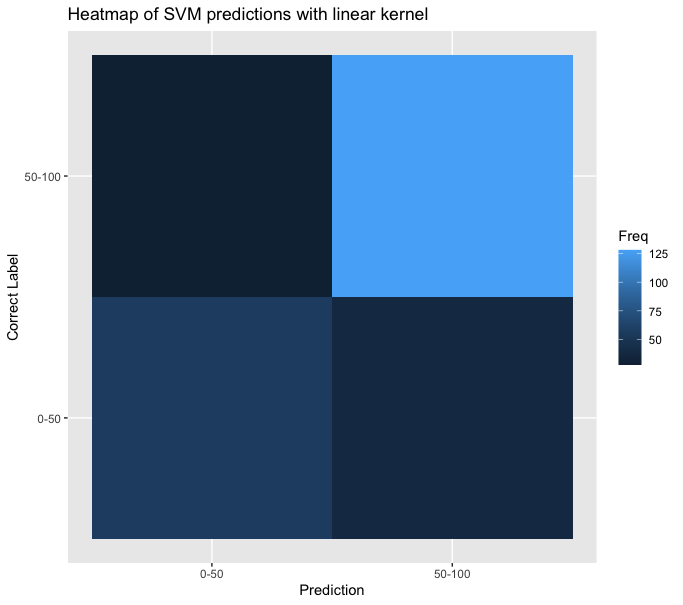
Model Accuracy is is 73% with 60% sensitivity and 82% specificity
Polynomial Kernel

Similar yet different from the linear kernel, the polynomial kernel
seems to creating a clear cut off from Thursday through sunday.What
this means is that there exists a significant difference in batterty
levels bewteen the beginning three days of the week and ending four.
This is new insight that we were not able to obtain from the linear kernel.
This also makes sense since analytically since the polynomial kernel has a higher accuracy rate.
Polynomial Kernel Heat Map
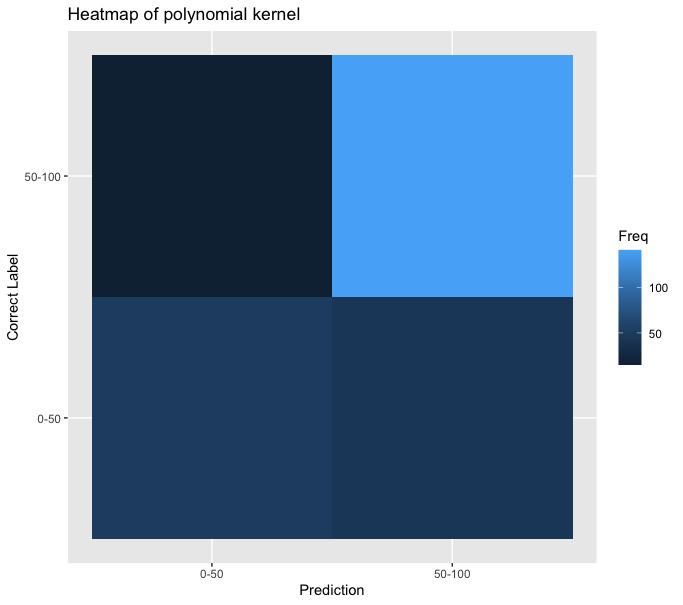
Model Accuracy is is 76% with 53% sensitivity and 90% specificity
so far, the pair "day of week" and binary variable "weekday/weekend" has been used.
With developing a new understanding from our data, the RBF kernel has been ran on a new
set of variables. Since it was learned that there is a significant difference bewteen
weekends and weekdays, an interesting question to look at is whether the hours of the
day and day of week make a significant difference as well.
RBF Kernel

It can be seen that `on saturday and sunday, from 12PM-12AM a
significant amount of predictions show that the bikes have a battery
level less than 50%.additionally,
RBF kernel Heatmap
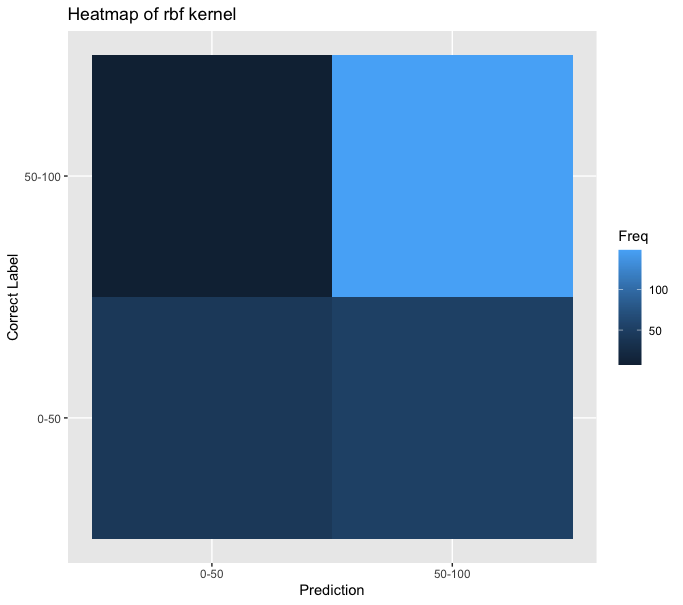
Model Accuracy is is 76% with 44% sensitivity and 95% specificity
SVM for Text Data in Python
raw data
code
Three SVMs with different kernels have been applied to the data. The kernels are as follow: 1) Linear kernel 2) RBF kernel 3) Sigmoid Kernel
The graphs below are the result of these kernels.
Linear Kernel
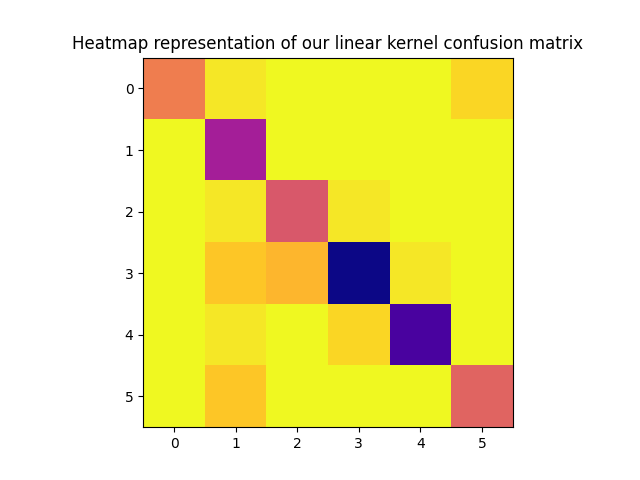
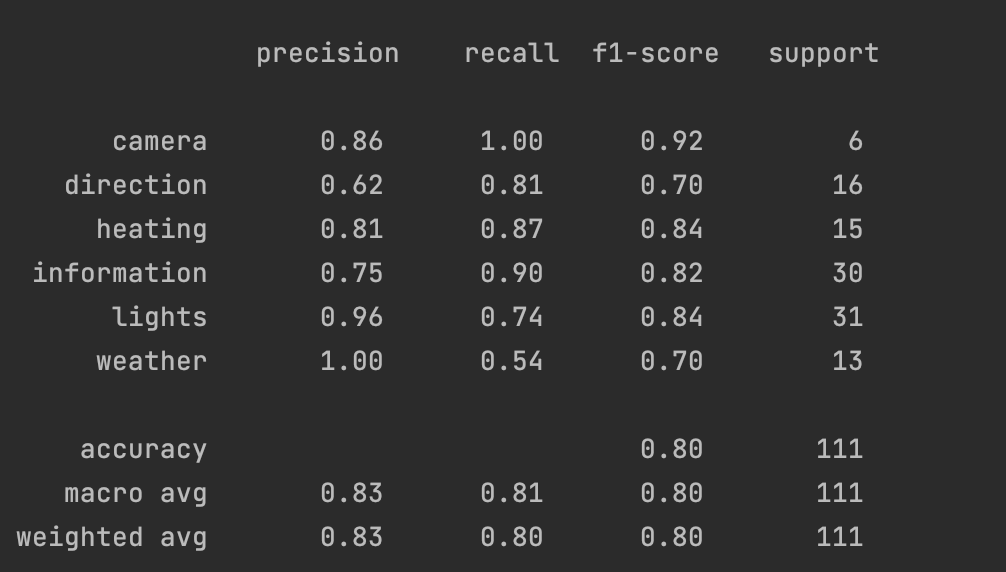
Overal model accuracy is 80%. the camera and lights category are significantly predictable.
RBF kernel
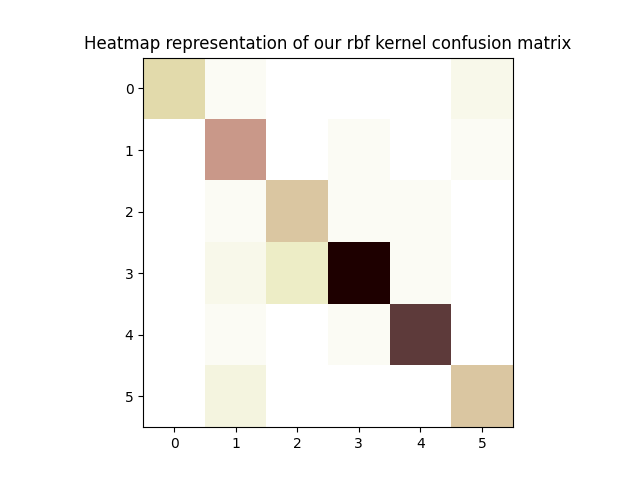
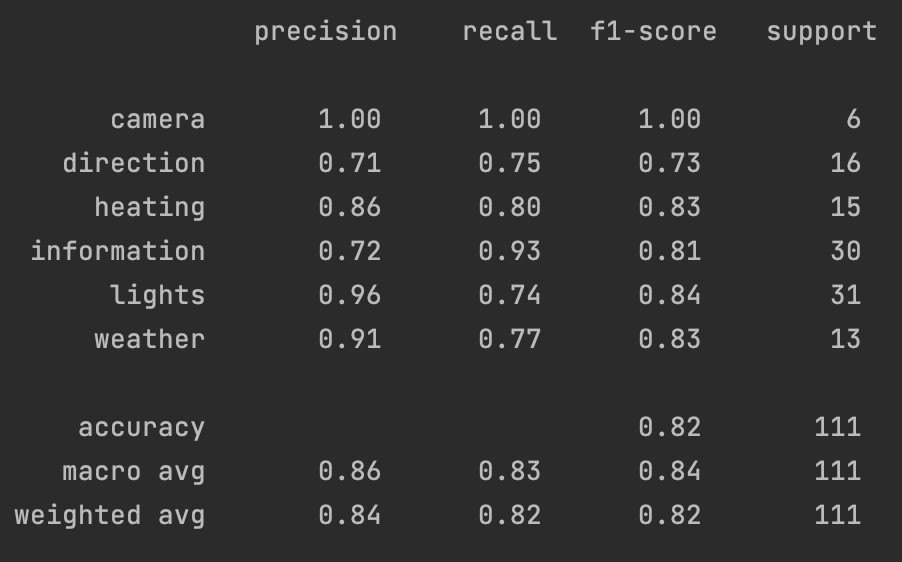
Overal model accuracy imporved to 82% camera, heating, lights, weather significantly predictable.
Sigmoid kernel
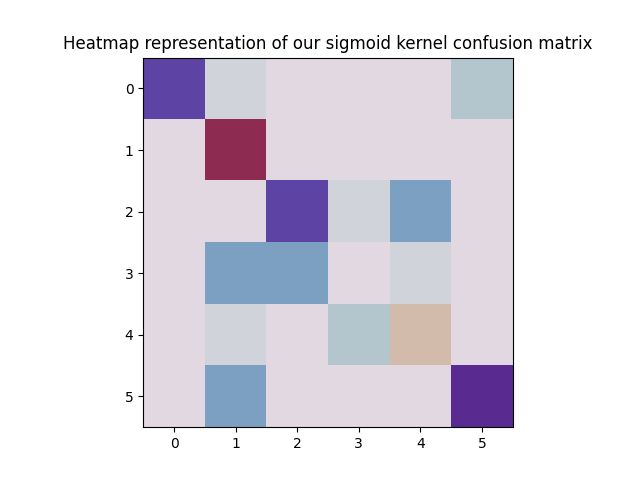
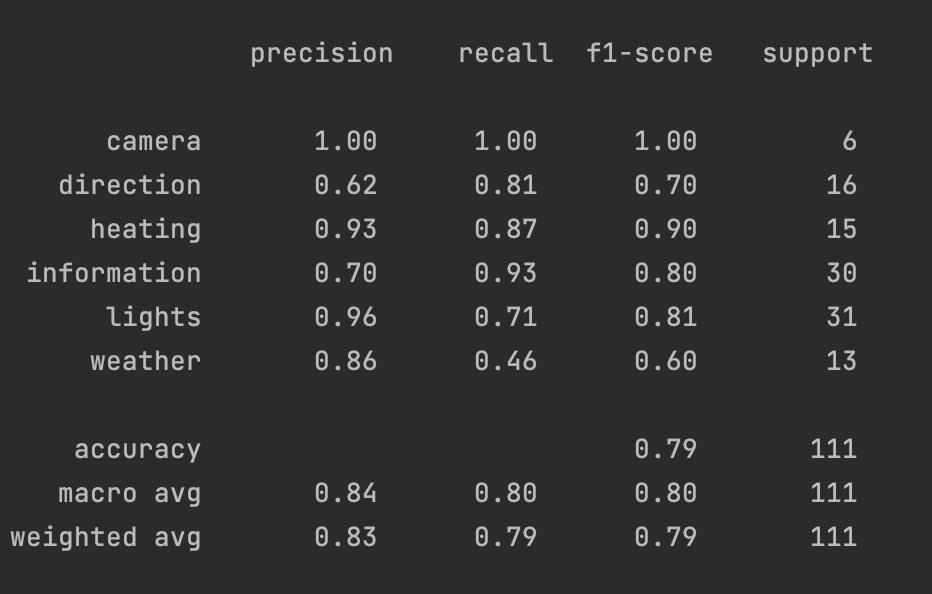
model accuracy has decreased to 79%. The expeceted variables are still significantly predictable.
Conclusion
The SVM models proved to be very powerfull both the text data as well as the record data.
Using the SVM we were able to understand something new about the battery patterns in the bikes,
it turns out that on mondays, the battery percentages tend to be higher. But by Wednesday, a significant
amount of bikes had battery percentages lower than 50%, Further more, on saturday and sunday nights there
were a significant number of bikes with battery percentages lower than 50%.
In the text data, it is observed that the SVM enables users to get amazing predictive ability.
The RBF model with 82% accuracy had the best overal performance, but some categories were predicted correctly
upto 96% of the time. This can be used in predicting and optimizing commands given to smart home devices. If our
model is able to produce an accurate prediction of the command being given, it can use this to optimize performance and lower the cost of execution.
NETID : MZ569


