
This page attempts to describe the findings of this project in a manner which is understandable to the non technical reader. The content of this page will be seperated into two sections. The first section will explain findings in relation to the Moby-Bikes and the second will explain findings regarding smart homes devices.
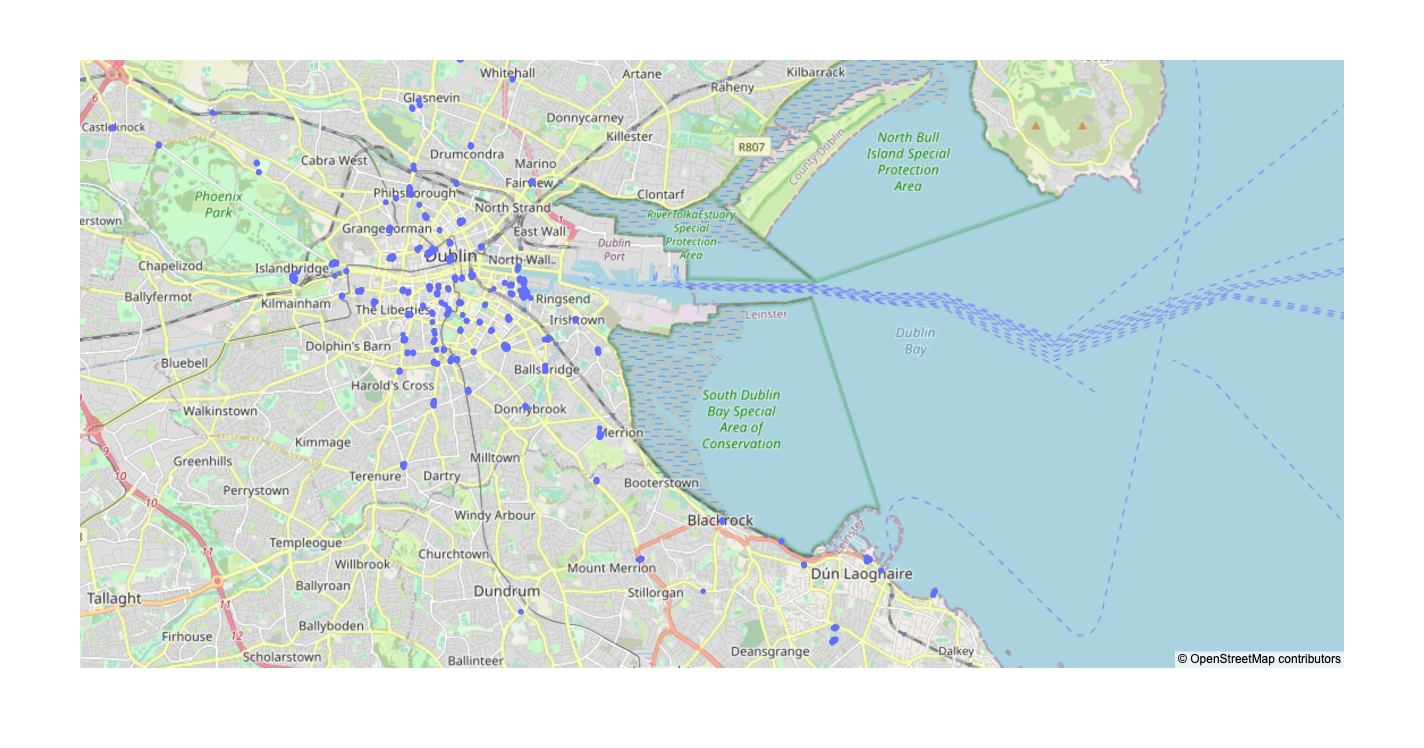
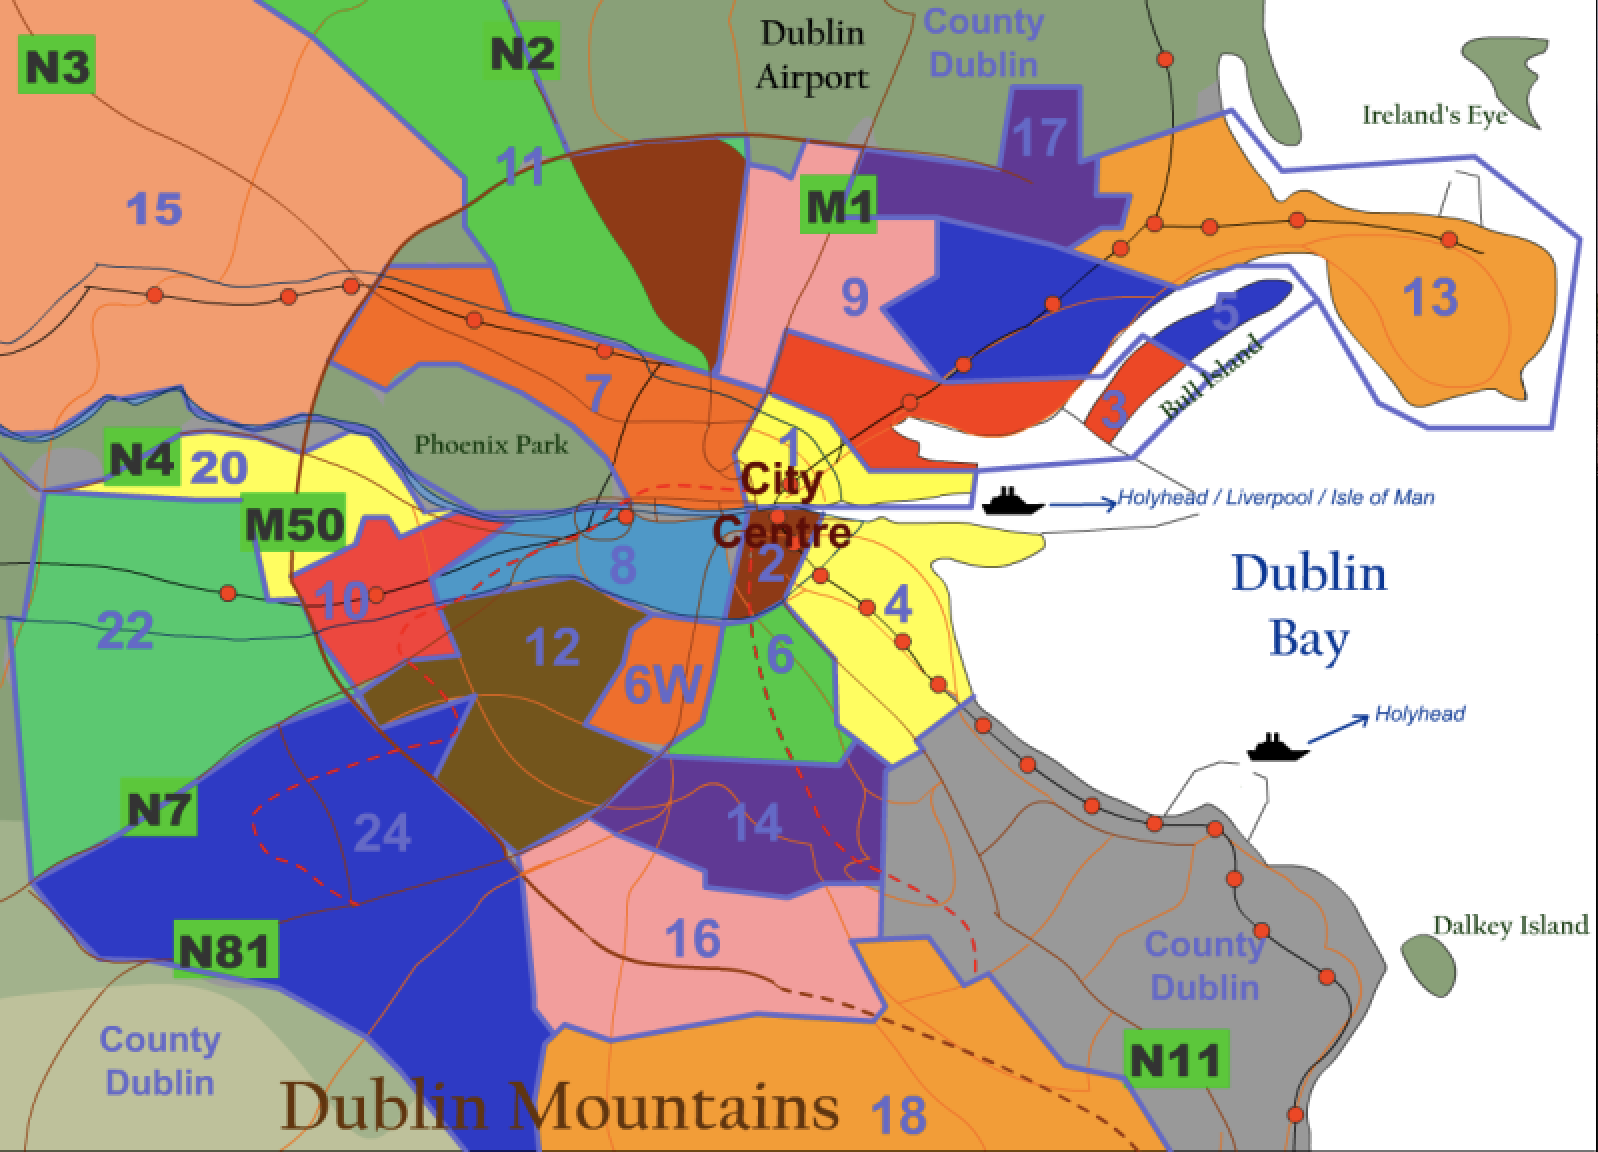
The analysis provided excellent insight into the nature of the bikes and there distribution in the city of dublin. The analysis shows that the bikes are concentrated in two main groups, which can also be seen in their general distribution in and around the city of dublin! one of these areas has an extreme concentration of bikes while the other has significantly less concentration. By converting the longitude and latitude of each bike into an exact address location, it can be observed that the heavily concentraded area is the city center and the second area is in dublin county which is a residential area. The graph on the left is a graph plotted using the latitude and longitude of each individual bike. The graph on the right is a general map of the city of dublin seperated by zip codes ( I am only the author of the graph on the left. The graph on the right can be found here )


Further analysis was conducted to determine whether or not it is possible to estimate the battery percentage of a bike within an interval. The two intervals were chosen for this analysis were : 0-50 and 50-100. Multiple models were constructed for this purpose, each providing different results and accuracies in prediction. Although there were inconsistencies in the comparissons of accuracies of different models, all most all models showed that the two most important parameters for predicting the battery percentage interval were : miles traveled within the past 30 minutes to 1 hour, the type of bike (There are three types of bikes in the dataset; The general rental bike, bikes the company has sold to private individuals and bikes that need repair and are in the workshop) and whether it was a week day or a weekend. The importance of miles traveled is quite trivial for the human mind, but the importance of weekdays and weekends suggested that there may be more information that could be mined from the data.
By analyzing the necessary data needed to better understand the importnace of weekends and weekdays, it is found that the closer the day is to the weekend ( a trend that starts on Thursdays) the predictions for battery percentages in the lower interval increases. Addtitionally, Saturday and Sunday nights, between the hours of 6 PM and 12 AM a similar trend is found!!
In the smart homes section the analysis provided interesting information and insight as well. One objective of the analysis wasto find the words that are used most commonly for our categories of interest.
Through the the applied methods it was found that i regards to the houses heating, the most commonly used words were : "Heating", "turn", "cold", "little" and "hour". Similarly, for the categorie of commands
relating to directions top used words are : "Home", "Busses", "Nearest", "Departure", "Train". The commonly words used in regards to the weather are: "Outside", "Shine", "Freeze, "Rain" and "weather".
In a seperate section the relationship between words used in regards to the "lights" category was analyzed. It was concluded that the word "turn" and light were in the same commands 45% of the times. similarly,
the word "make" was in the same commands as lights 25% of the times. Additionally, it was found that every time the word room or dark was used, it was in regards to the lights. Moreover, the pairs of words
{less} ==> {Make}, {can, less} ==> {Make}, {less, lights} ==> {Make}, {can, less, lights} ==> {Make} are very dependent on eachother and can be used for prediction. This prediction can be used to minimize the time it takes
for these smart devices to complete tasks.
A third section of the analysis focused on whether or not it would be possible to identify the correct number of types of commands. To clarify, if there are a number of commands pertaining to 5 different parts of the house or appliences, would it be possible to
identify this? The result of the analysis proved quite promissing. The analysis and produced method has applications in cases where the objective is to understand what different types of commands are being used. In some cases, this may be the final objective
while in other cases this can become a single yet critical part of an even larger analysis.
Matene Zamaninia
MZ569