Data Cleaning
The Focus of this section will be on Data Cleaning which is the most time consuming and also critical part of the data science Life cycle. Examples of the following will be demonstrated:
Text Data Cleaning in Python
Record Data Cleaning in Python
Record Data Cleaning in R
Cleaning Visualizations in R
Text Data Cleaning in
Python
This example utilizes a dataset pertaining to commands given to smart home devices.
The dataset can be seen here. The dataset contains 7 columns.
From these seven columns, attention will be directed to the "Category" (Which is our Label) column and the commands. The commands have been
tokenized to pertain to partiuclar words in specific categories. The corresponiding data set can be found here .

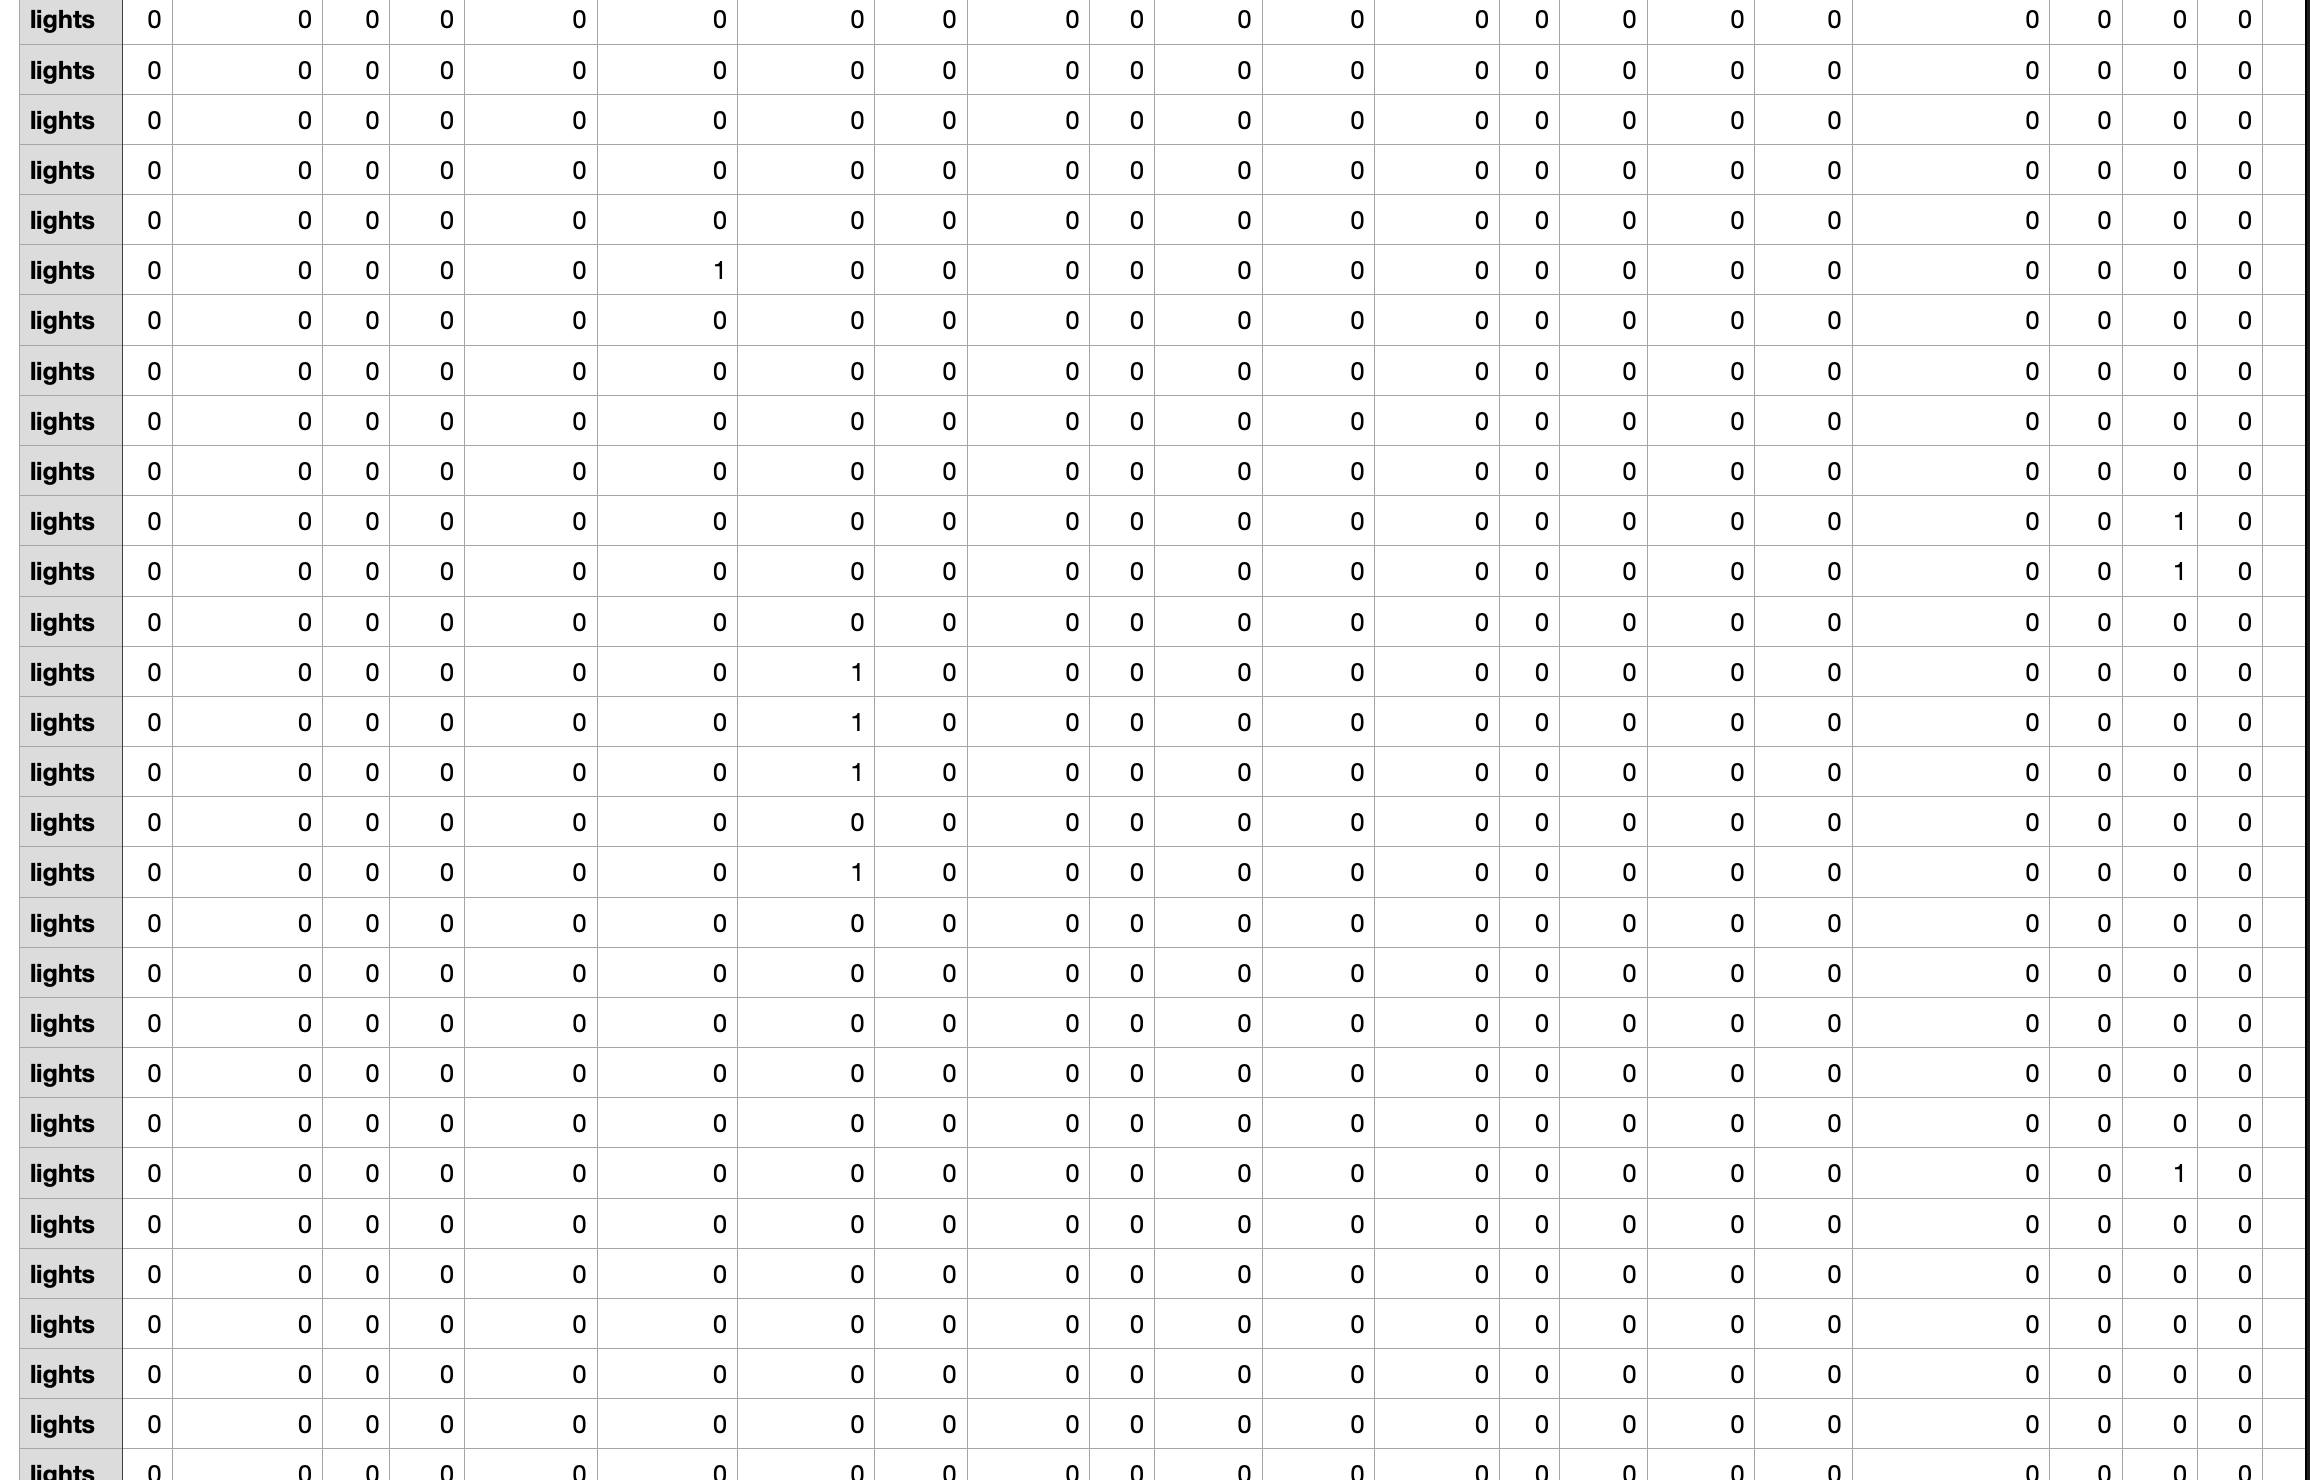
In the next step, an aggregation of data based on category was conducted. This aids in better understanding our data. The result of which has
been modified into the resulting dataset .

To View the text cleaning code click here .
Record Data Cleaning in
Python
This example utilizes a dataset about a bike sharing company in Dubline, Ireland. The dataset is initially composed of 15 variables and 27253 rows and can be seen
here .
Redundent and Irrelavent Data
From the metadata we can see that three of the columns are the same so tow of them have been omitted. In the next list-style-type
we check the uniqueness of the qualitative varibales to familiarize ourselves with our data further. In this step, we see that three of the variables,IsEBike, IsMotor, IsSmartLock, each take only take one value.
since this does not add anythin to our analysis, we will omit these columns as well. There is one row in the data set that has "0" values for "latitude" and "Longitude" this row was also omitted.
Battery
The Battery variable required substantial amount of cleaning as it contained both incorrect values and missing values.
In our analysis we find that some battery values seem to be negative. Such rows were omitted. For the missing values, we check to find the variance on of the values to see if it is poosible to replace such values with
the mean or median. We find that the battery variable has a large variance and as such we are unable to replace the missing values. These values pertain to less than 2% of our data, so deleting them would not have a significant impact on the analysis.
Feature generation
It would be desirable to find the mileage of distance travled in each time period by each bike. As such , the "Haversine" formula was defined as a function. A thorough explanation of the Haversine as well as its defining function can be found
here . In short, the Haversine formula obtains the "Great Circle Distance Between two points on a sphere given the points Latitude and Longitude". The mathematical
formula of the Haversine formula is brought below.

This new column will be further manipulated and used in our analysis. The cleaned data set including the generated feature can be found here .
In addition to the cleaning, a geolocation map of the city of dublin with the location of all bikes has been created and visualized in the exploration section of this website for your viewing.
To view the code, click here .
Record Data Cleaning in
R
For our data cleaning in R, we will be focusing on the same Bike data set mentioned in the Python section. However, because of the graphical abilities of
R, we will add visualizations that help us in better observing our data. To see all graphs related to the data cleaning, as well as the location of the bikes in the city of dublin navigate to the data exploration section.
to view the raw data click here . The data cleaning code as well as visualizations
for data exploring can be found in this R markdown file .
For the cleaned data see here
NETID : MZ569


